Trace 使用手册
1. 下载
OpenOCD/NexRv 下载路径:资源下载中心
GDB 包含在交叉编译工具链中,请参考《交叉编译工具链使用手册》
2. Trace 的原理
硬件会记录每次跳转指令的实际执行结果,并将 Trace 数据保存到一块专用内存中。软件在读取这些数据后,结合 ELF 文件解析,即可重建程序的 PC 跳转轨迹。
死机问题分析流程:
-
系统死机之前,需要通过以下方式之一启动 Trace:
-
使用 JTAG 操作寄存器
-
操作 Linux 的 sysfs 节点
-
-
系统死机之后,通过 JTAG 等方式读取 Trace 数据,从而获得程序的 PC 跳转轨迹,为问题分析提供依据。
3. Trace的操作方式
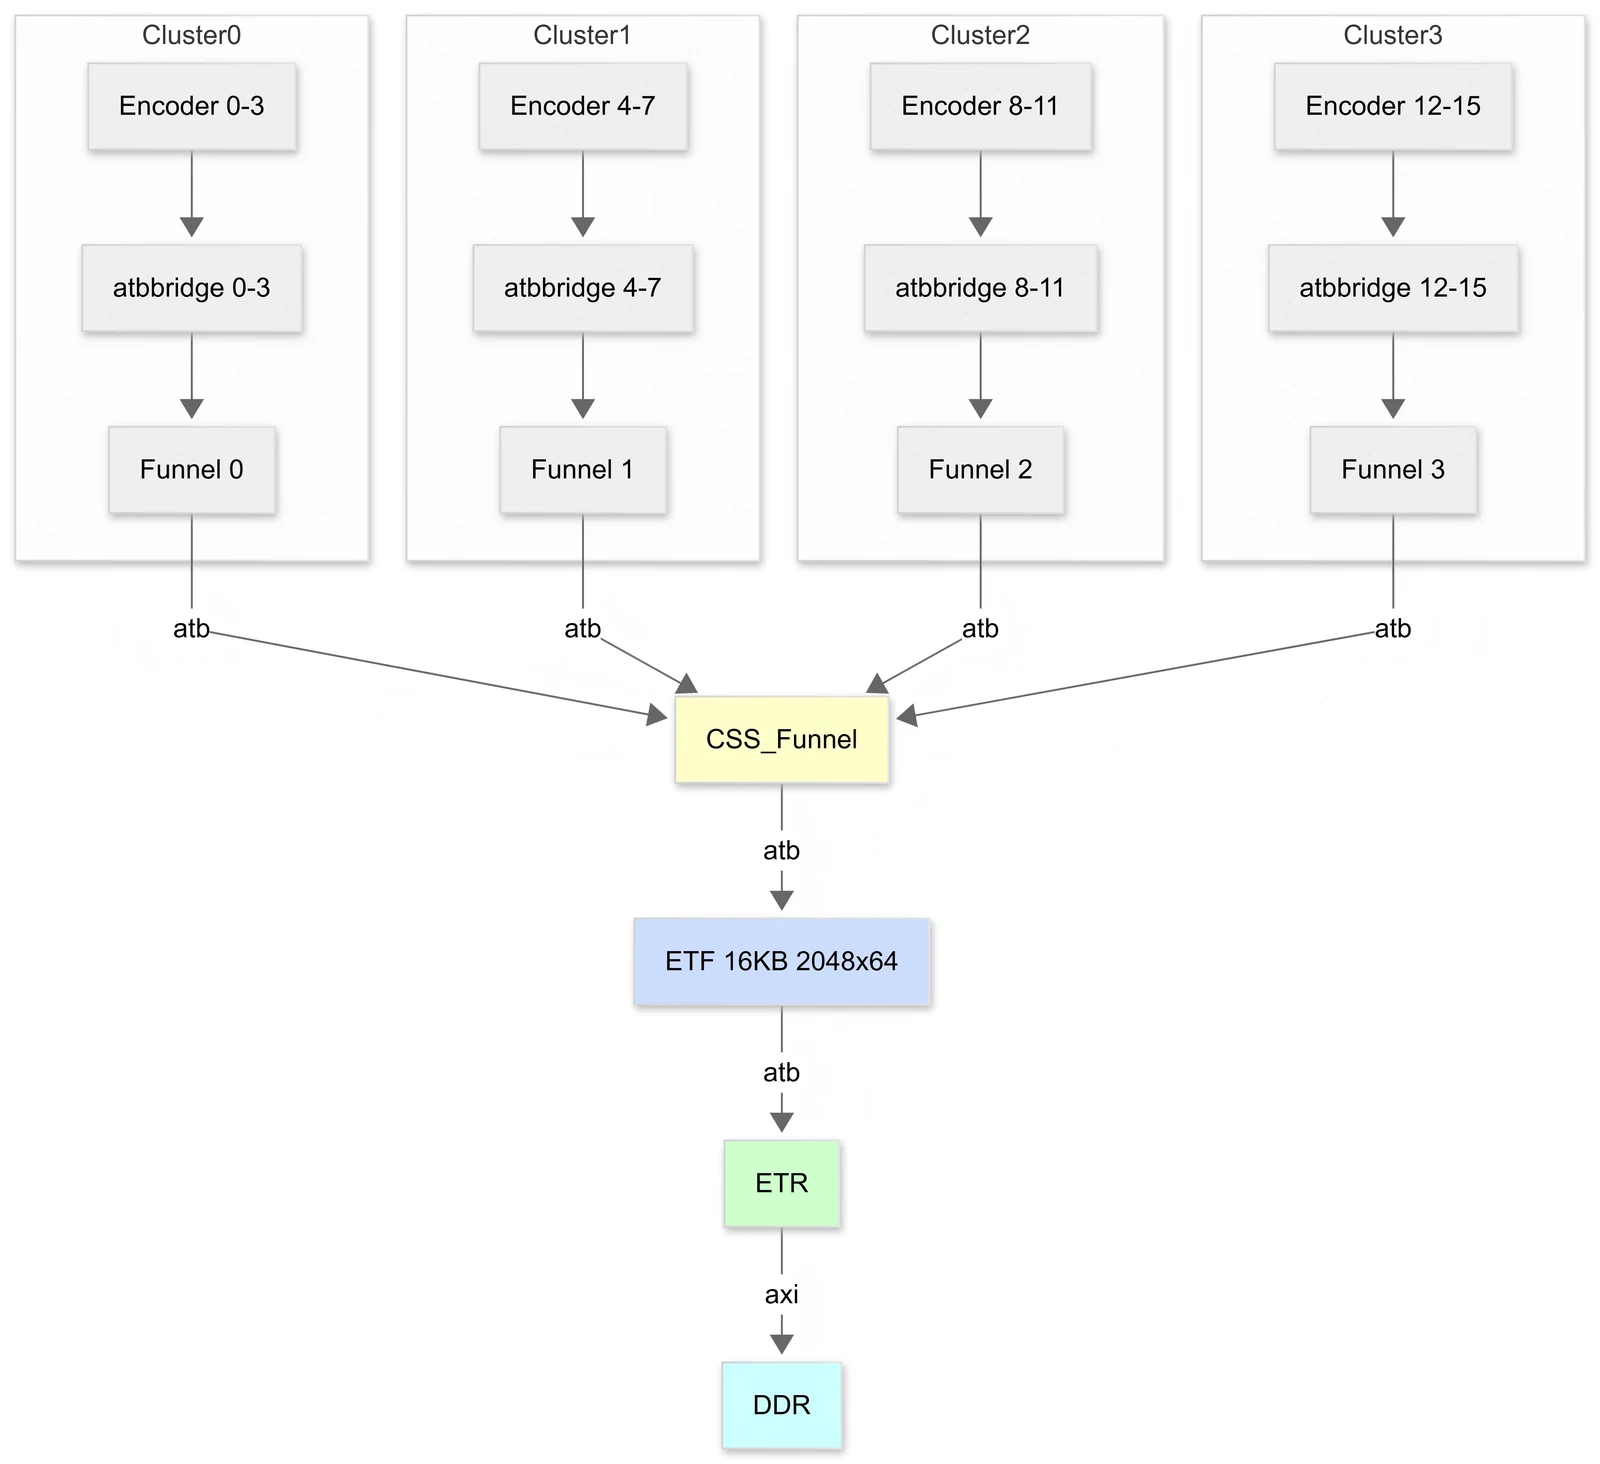
K3系列板基于 RISC-V N-trace 协议实现 Trace 功能,其组件拓扑结构如上图所示。
支持通过以下方式使用 Trace 功能:
| 方法 | 描述 |
|---|---|
| JTAG | 连接硬件的JTAG口,通过提供的gdb/openocd命令,配置指令tracing开启关闭 |
| 连接硬件的JTAG口,通过提供的gdb/openocd命令,手工配置trace enable。通过配置触发器,在满足条件的时候自动触发指令tracing开启/关闭,支持的条件有: 1. 指定地址处的指令被执行(类似断点) 2. 指定地址处的数据被load/store(类似观察点) 3. 执行1条指令 4. 发生预期的中断或异常 | |
| sysfs | 通过Linux内核提供给用户空间的sysfs节点,手工配置指令tracing开启/关闭 |
| perf | 配合Linux perf工具使用 |
注意:
-
Trace在多进程环境下,需要linux内核在调度时写scontext CSR。
-
Trace不记录非跳转指令,不记录大部分指令的绝对地址,因此需要严格匹配的ELF文件才能解析。
-
Trace不记录 load store 数据的结果,只记录跳转。以目前使用的 N-Trace 为例,其规范当前尚未支持 Data Trace 功能。
3.1 使用JTAG接口
3.1.1 配置说明
在开始使用 Trace 之前,需要先配置相关 Trace 组件的基地址及参数,SpacemiT OpenOCD 提供 Trace 的配置脚本,可参考 tcl/spacemit/spacemit-k3-trace.cfg 进行配置。
3.1.1.1 RISC-V 组件
RISC-V Trace 组件包括 Encoder 、ATB Bridge 和 Funnel 类型,可以通过rvtrace create 命令创建抽象实体:
rvtrace create <name> <type> -target <target_name> -base <address>
rvtrace create <name> <type> -dap <dap_name*>* -ap-num <apn> -baseaddr <address>
@type:encoder atbbridge funnel
注:执行 rvtrace create 命令时,必须配置以下两种组合参数之一:
-
-target target_name-base addr(通过 RISC-V target 控制 Trace 组件, K3 只支持此方式。) -
-dap dap_name-ap-num apn-baseaddr addr(通过ARM DAP 控制 Trace 组件)
Trace Encoder 组件配置:可以对其支持的 spec 中定义的相关配置进行控制,具体请参考:
rvtrace create encoder0 encoder -target $_TARGETNAME.$_coreid  -base 0xd9002000
encoder0 configure ...
@-inst-mode: Instruction trace generation mode (off|resv1|resv2|btm|resv4|resv5|htm|resv7, btm(Branch Trace Messaging) and htm(History Trace Messaging), k3 support only btm)
@-context: Controls generation of Ownership messages (on|off)
@-trigger: Allows trTeInstTracing to be set or cleared by Trace-on and Traceoff signals (on|off)
@-sync-mode: Select the periodic instruction trace synchronization message/packet generation mechanism (off|messages|clock|instruction, k3 support only clock)
@-sync-max: The maximum interval between instruction trace synchronization messages/packets. Generate synchronization when count reaches 2^(sync_max+4)
@-srcid: Trace source ID assigned to this trace encoder
@-srcbits: The number of bits in the trace source field (0..12)
@-timestamp:Enable for timestamp field in trace messages/packets (on|off).
如果配置-timestamp on,则可以进一步配置 Encoder 组件的 Timestamp 子组件的参数:
@-ts-run-debug:counter runs/stopped when hart is halted (off|on)
@-ts-mode: Mode used by Timestamp unit (none|external|system|core|shared|resv5|resv6|resv7)
@-ts-prescale: Prescale timestamp input clock
ATB Bridge 组件配置:需要配置-id参数, 其中 0x00 和 0x70-0x7F 为保留值。
@-id: ID of this node on ATB
Funnel 组件配置:需要配置-ports 参数,打开输入端口接收每个 Encoder 的输出数据:
@-ports: control inputs
如果配置 -timestamp on,则可以进一步配置 Funnel 组件的 Timestamp 子组件的参数,同 Encoder。
3.1.1.2 Coresight 组件
Coresight Trace 组件包括 Funnel 、TMC 和 Timestamp 类型,可以通过cstrace create 命令创建抽象实体:
cstrace create <name> <type> -target <target_name> -base <address>
rvtrace create <name> <type> -dap <dap_name*>* -ap-num <apn> -baseaddr <address>
@type:funnel tmc timestamp
注: 执行 cstrace create 命令时必须配置以下两种组合参数之一:
-
-target target_name-base addr(通过 RISC-V target 控制 Trace 组件, K3 只支持此方式。) -
-dap dap_name-ap-num apn-baseaddr addr(通过ARM DAP 控制 Trace 组件)
Funnel 组件配置:需要配置-ports 参数,打开输入端口接收每个 Cluster 的输出数据:
cstrace create main_funnel funnel -target $_TARGETNAME -base 0xd9042000 -ports 0x1
# cstrace create main_funnel funnel -target $_TARGETNAME -base 0xd9042000
# main_funnel configure -ports 0x1
TMC 组件配置:
-
包括 ETB、ETF 和 ETR三种类型组件
-
配置时,需指定基地址,并通过配置
-tmc-type参数确定 TMC 组件类型 -
对于 ETR 类型,还需配置 Trace Buffer 的地址和大小
cstrace create etf tmc -target $_TARGETNAME -base 0xd9043000 -tmc-type etf
cstrace create etr tmc -target $_TARGETNAME -base 0xd9043000 -tmc-type etr
etr configure -hwaddr 0x170000000 -buf-size 0x1000000
@-tmc-type:etb etf etr
3.1.2 Trace 控制
使用 Trace 前,需要编辑 bin 目录下的K3脚本,根据需求将 RVTRACE 和 CSTRACE 设置为1。保存配置后,双击执行脚本,即可看到如下日志输出:
Info : [encoder.0] type=0x1, version=0x10
Info : [encoder.0] Trace recording/protocol format: N-Trace
Info : [encoder.1] type=0x1, version=0x10
Info : [encoder.1] Trace recording/protocol format: N-Trace
Info : [encoder.2] type=0x1, version=0x10
Info : [encoder.2] Trace recording/protocol format: N-Trace
Info : [encoder.3] type=0x1, version=0x10
Info : [encoder.3] Trace recording/protocol format: N-Trace
Info : [encoder.4] type=0x1, version=0x10
Info : [encoder.4] Trace recording/protocol format: N-Trace
Info : [encoder.5] type=0x1, version=0x10
Info : [encoder.5] Trace recording/protocol format: N-Trace
Info : [encoder.6] type=0x1, version=0x10
Info : [encoder.6] Trace recording/protocol format: N-Trace
Info : [encoder.7] type=0x1, version=0x10
Info : [encoder.7] Trace recording/protocol format: N-Trace
Info : [encoder.8] type=0x1, version=0x10
Info : [encoder.8] Trace recording/protocol format: N-Trace
Info : [encoder.9] type=0x1, version=0x10
Info : [encoder.9] Trace recording/protocol format: N-Trace
Info : [encoder.10] type=0x1, version=0x10
Info : [encoder.10] Trace recording/protocol format: N-Trace
Info : [encoder.11] type=0x1, version=0x10
Info : [encoder.11] Trace recording/protocol format: N-Trace
Info : [encoder.12] type=0x1, version=0x10
Info : [encoder.12] Trace recording/protocol format: N-Trace
Info : [encoder.13] type=0x1, version=0x10
Info : [encoder.13] Trace recording/protocol format: N-Trace
Info : [encoder.14] type=0x1, version=0x10
Info : [encoder.14] Trace recording/protocol format: N-Trace
Info : [encoder.15] type=0x1, version=0x10
Info : [encoder.15] Trace recording/protocol format: N-Trace
Info : [atbbridge.0] type=0xe, version=0x10
Info : [atbbridge.1] type=0xe, version=0x10
Info : [atbbridge.2] type=0xe, version=0x10
Info : [atbbridge.3] type=0xe, version=0x10
Info : [atbbridge.4] type=0xe, version=0x10
Info : [atbbridge.5] type=0xe, version=0x10
Info : [atbbridge.6] type=0xe, version=0x10
Info : [atbbridge.7] type=0xe, version=0x10
Info : [atbbridge.8] type=0xe, version=0x10
Info : [atbbridge.9] type=0xe, version=0x10
Info : [atbbridge.10] type=0xe, version=0x10
Info : [atbbridge.11] type=0xe, version=0x10
Info : [atbbridge.12] type=0xe, version=0x10
Info : [atbbridge.13] type=0xe, version=0x10
Info : [atbbridge.14] type=0xe, version=0x10
Info : [atbbridge.15] type=0xe, version=0x10
Info : [funnel.0] type=0x8, version=0x10
Info : [funnel.1] type=0x8, version=0x10
Info : [funnel.2] type=0x8, version=0x10
Info : [funnel.3] type=0x8, version=0x10
启用 Trace时,需要按序依次打开每个 Trace 组件。脚本中已预定义相应控制函数,用户只需执行对应命令即可。
> start_all_trace
encoder.0: Instruction trace is being generated
encoder.1: Instruction trace is being generated
encoder.2: Instruction trace is being generated
encoder.3: Instruction trace is being generated
encoder.4: Instruction trace is being generated
encoder.5: Instruction trace is being generated
encoder.6: Instruction trace is being generated
encoder.7: Instruction trace is being generated
encoder.8: Instruction trace is being generated
encoder.9: Instruction trace is being generated
encoder.10: Instruction trace is being generated
encoder.11: Instruction trace is being generated
encoder.12: Instruction trace is being generated
encoder.13: Instruction trace is being generated
encoder.14: Instruction trace is being generated
encoder.15: Instruction trace is being generated
> disable_all_trace
如果仅需启用一条通路上的 Trace,可以执行以下命令:
> start_trace 0
encoder.0: Instruction trace is being generated
> disable_trace 0
Trace Buffer 中的内容可通过以下命令从 DDR 读取。
> dump_trace trace.bin
3.1.3 配合Trigger使用
通过配合 Trigger(mcontrol/etrigger/itrigger/icount)实现对 Trace 的启动/停止控制。
例如:设置 mcontrol Trigger 后,可控制 Trace 在特定地址打开和关闭。
> enable_all_trace
> riscv mcontrol set m s u execute 0xffffffff80272738 trace_on
> riscv mcontrol set m s u execute 0xffffffff80272746 trace_off
3.1.4 Linux S 态程序 Trace 支持
K3 已支持在多进程环境下,在调度时将 pid 写入scontext CSR 以区分不同进程。
在内核退出S态时,由 Trigger 设置 Trace-notify,发出完整 PC 和 Ownership 包以辅助解析。
$ riscv64-unknown-elf-objdump -d linux-6.12/vmlinux > vmlinux.objdump
$ grep sret vmlinux.objdump
ffffffff8027963c:       10200073                sret
ffffffff80279776:       10200073                sret

Open On-Chip Debugger
> riscv mcontrol set m s u execute 0xffffffff8027963c trace_notify
> riscv mcontrol set m s u execute 0xffffffff80279776 trace_notify
3.2 使用sysfs接口
3.2.1 配置说明
进入Linux menuconfig ,打开 CORESIGHT 相关配置
Location:                                                                                                                                                                                                                                                                               │
    -> Device Drivers                                                                                                                                                                                                                                                                     │
      -> HW tracing support                                                                                                                                                                                                                                                               │
        -> CoreSight Tracing Support (CORESIGHT [=y])
          -> CoreSight Link and Sink drivers (CORESIGHT_LINKS_AND_SINKS [=y])
            -> Coresight generic TMC driver (CORESIGHT_LINK_AND_SINK_TMC [=y])
          -> RISC-V Trace Support (RVTRACE [=y])
            -> RISCV Trace Encoder driver (RVTRACE_ENCODER [=y])
3.2.2 Trace控制
在开始跟踪收集数据之前,需要先识别 CoreSight sink。
/sys/bus/coresight/devices # ls
atbbridge0  atbbridge10  atbbridge12  atbbridge14  atbbridge2  atbbridge4  atbbridge6  atbbridge8  encoder0  encoder10  encoder12  encoder14  encoder2  encoder4  encoder6  encoder8  funnel0  rvtrace_funnel1  rvtrace_funnel3  tmc_etr0 atbbridge1  atbbridge11  atbbridge13  atbbridge15  atbbridge3  atbbridge5  atbbridge7  atbbridge9  encoder1  encoder11  encoder13  encoder15  encoder3  encoder5  encoder7  encoder9  rvtrace_funnel0  rvtrace_funnel2  tmc_etf0
/sys/bus/coresight/devices # ls tmc_etr0/
buf_mode_preferred  buf_modes_available  buffer_size  connections  enable_sink  mgmt  power  stop_on_flush  subsystem  trigger_cntr  uevent  waiting_for_supplier
/sys/bus/coresight/devices #
ETF 缓冲区模式:
-
支持 flat(连续) 和 tmc-sg(离散)
-
auto:按顺序尝试使用 flat 或 tmc-sg 模式分配 buffer_size。
buffer_size 默认是 1MB,可以通过 tmc_etr0/buffer_size 控制缓冲区大小。当 buffer_size 超过 1MB 时,通常是使用了 tmc-sg 模式构建缓冲区。
root@k3:/sys/bus/coresight/devices# cat tmc_etr0/buf_modes_available
auto flat tmc-sg
/sys/bus/coresight/devices # cat tmc_etr0/buffer_size
0x100000
/sys/bus/coresight/devices # cat tmc_etr0/buf_modes_available
auto flat tmc-sg
/sys/bus/coresight/devices # cat tmc_etr0/buf_mode_preferred
auto
/sys/bus/coresight/devices # echo 0x10000000 > tmc_etr0/buffer_size
/sys/bus/coresight/devices # cat tmc_etr0/buffer_size
0x10000000
在任何时刻,可以启用的sink(或source)数量均没有限制。作为通用操作,所有与sink相关的设备类在 sysfs 中均提供一个 active 入口:
/sys/bus/coresight/devices # echo 1 > tmc_etr0/enable_sink
/sys/bus/coresight/devices # cat tmc_etr0/enable_sink
1
/sys/bus/coresight/devices #
enable a source 将立即触发 tracing:
/sys/bus/coresight/devices # echo 1 > encoder0/enable_source
[ 1132.975639] coresight encoder0: Trace encoder tracing enabled
/sys/bus/coresight/devices # cat encoder0/enable_source
1
/sys/bus/coresight/devices #
tracing 以相同的方式停止:
/sys/bus/coresight/devices # echo 0 > encoder0/enable_source
[ 1140.708439] coresight encoder0: Trace encoder tracing disabled
/sys/bus/coresight/devices #
通过寄存器查看 ETR 缓冲区是否已满:
-
STS 寄存器第一个 bit 判断是否 FULL
-
dba 寄存器为缓冲区的基地址
-
rsz * 4为缓冲区大小
-
rrp 是读指针
-
rwp 是写指针
root@k3:/sys/bus/coresight/devices# ls tmc_etr0/mgmt/
authstatus  axictl  ctl  dba  devid  ffcr  ffsr  mode  pscr  rrp  rsz  rwp  sts  trg
root@k3:/sys/bus/coresight/devices# cat tmc_etr0/mgmt/sts
0xd
root@k3:/sys/bus/coresight/devices# cat tmc_etr0/mgmt/dba
0x16c8b8000
root@k3:/sys/bus/coresight/devices# cat tmc_etr0/mgmt/rsz
0x40000
root@k3:/sys/bus/coresight/devices# cat tmc_etr0/mgmt/rrp
0x1066082b0
root@k3:/sys/bus/coresight/devices# cat tmc_etr0/mgmt/rwp
0x1066082b0
ETR 缓冲区的内容可以直接从 /dev 获取,默认数据大小为 1MB。
root@k3:/sys/bus/coresight/devices# dd if=/dev/tmc_etr0 of=/trace.bin
2047+2 records in
2048+0 records out
1048576 bytes (1.0 MB, 1.0 MiB) copied, 0.00694213 s, 175 MB/s
3.2.3 Boot-time 开启 Trace
对于在 Boot 阶段卡死的场景,可以通过在 cmdline 中添加参数控制 Trace 开启。
root@k3:~# cat /boot/env_k3.txt
knl_name=vmlinuz-6.18.3-generic
ramdisk_name=initrd.img-6.18.3-generic
dtb_dir=spacemit/6.18.3-generic
ramdisk_addr=0x130000000
loglevel=8
commonargs=setenv bootargs clk_ignore_unused plymouth.prefer-fbcon plymouth.ignore-serial-consoles splash
-
按
s进入U-Boot -
在 cmdline 中添加参数:
-
rvtrace-encoder.boot_enable=1和coresight-tmc.sysfs_etr_activated=1控制 Trace 组件自动开启 -
maxcpus=1控制单核启动
-
=> env print commonargs
commonargs=setenv bootargs clk_ignore_unused plymouth.prefer-fbcon plymouth.ignore-serial-consoles splash
=> env set commonargs "setenv bootargs clk_ignore_unused plymouth.prefer-fbcon plymouth.ignore-serial-consoles splash rvtrace-encoder.boot_enable=1 coresight-tmc.sysfs_etr_activated=1 maxcpus=1"
=> boot
在启动日志中看到以下信息,说明 Trace 开启成功。
[    3.902435] trace-encoder d9002000.encoder: CPU0: Trace Encoder initialized
[    3.909424] coresight encoder0: Trace Encoder tracing enabled
通过 OpenOCD dump Trace 数据,默认 buffer_size 是 1MB。
#telnet localhost 4444

Open On-Chip Debugger
> rvtrace names
encoder0
atbbridge0
cluster0_funnel
> cstrace names
main_funnel
etf
etr
ts
> etr status
[k3.cpu_x100.0] Can't save register fp on a hart that is not halted.
[k3.cpu_x100.0] Can't save register fp on a hart that is not halted.
Data buffer address:   0x105737000
RAM size:              0x100000
Mode:                  0x0
Status:                0x1
RAM read ptr:          0x10571e080
RAM write ptr:         0x10571e080
Control:               0x1
Axiclt:                0xfbe
Flush status:          0x0
Flush control:         0x133
> riscv virt2phys_mode off
> riscv set_mem_access sysbus
> etr tmc dump trace.bin
A total of 256 data pages were found (total size: 1.00 MB)
dumped 1048576 bytes in 30.184010s (33.925 KiB/s)
>
注意:如果需要扩大 buffer-size,在 dts 中配置 arm,buffer-size 节点。
--- a/arch/riscv/boot/dts/spacemit/k3-trace.dtsi
+++ b/arch/riscv/boot/dts/spacemit/k3-trace.dtsi
@@ -791,6 +791,7 @@ etr: etr@d9044000 {
                        clocks = <&dummy_clk>;
                        clock-names = "apb_pclk";
                        arm,scatter-gather;
+                       arm,buffer-size = <0x400000>;
                        in-ports {
                                port {
                                        etr_in_port: endpoint {
3.3 使用perf工具
3.3.1 配置说明
3.3.2 显示 rvtrace pmu - perf list
root@k3:~# perf list pmu

List of pre-defined events (to be used in -e or -M):

  rvtrace//                                          [Kernel PMU event]
3.3.3 目标跟踪采集 - perf record
由于跟踪器可以链接到多个接收器,因此需要识别哪一个接收器实际接收跟踪数据,并在 perf 命令行上将其作为选项提供。完成接收器识别后,即可开始跟踪收集。
root@k3:~# rm -rf ~/.debug
root@k3:~# perf record -e rvtrace/@tmc_etr0/ --per-thread uname
Linux
[ perf record: Woken up 1 times to write data ]
[ perf record: Captured and wrote 3.047 MB perf.data ]
3.3.4 跟踪解码 - perf report
分析之前通过 perf record 命令收集的性能数据:
root@k3:~# perf report --stdio
# To display the perf.data header info, please use --header/--header-only options.
#
RISC-V Trace: A FIFO overrun has resulted in the loss of one or more messages
RISC-V Trace: A FIFO overrun has resulted in the loss of one or more messages
...
#
# Total Lost Samples: 0
#
# Samples: 400K of event 'branches'
# Event count (approx.): 400355
#
# Children      Self  Command  Shared Object                Symbol
# ........  ........  .......  ...........................  ...........................................
#
    10.78%    10.78%  uname    ld-linux-riscv64-lp64d.so.1  [.] _dl_relocate_object_no_relro
     3.32%     3.32%  uname    libc.so.6                    [.] __memcpy_noalignment
     3.28%     3.28%  uname    [kernel.kallsyms]            [k] memcpy
     2.93%     2.93%  uname    [kernel.kallsyms]            [k] __rcu_read_unlock
     2.72%     2.72%  uname    ld-linux-riscv64-lp64d.so.1  [.] do_lookup_x
     2.45%     2.45%  uname    [kernel.kallsyms]            [k] __handle_mm_fault
     2.34%     2.34%  uname    [kernel.kallsyms]            [k] filemap_map_pages
     2.09%     2.09%  uname    [kernel.kallsyms]            [k] set_pte_range
     1.99%     1.99%  uname    [kernel.kallsyms]            [k] mod_memcg_lruvec_state
     1.99%     1.99%  uname    [kernel.kallsyms]            [k] __rcu_read_lock
     1.79%     1.79%  uname    [kernel.kallsyms]            [k] mas_walk
     1.56%     1.56%  uname    [kernel.kallsyms]            [k] next_uptodate_folio
     1.33%     1.33%  uname    [kernel.kallsyms]            [k] folio_add_file_rmap_ptes
     1.32%     1.32%  uname    [kernel.kallsyms]            [k] __lruvec_stat_mod_folio
     1.24%     1.24%  uname    [kernel.kallsyms]            [k] __kprobes_text_start
     1.08%     1.08%  uname    [kernel.kallsyms]            [k] memset
     1.03%     1.03%  uname    [kernel.kallsyms]            [k] get_page_from_freelist
     1.02%     1.02%  uname    [kernel.kallsyms]            [k] finish_fault
     0.98%     0.98%  uname    [kernel.kallsyms]            [k] flush_icache_pte
     0.96%     0.96%  uname    ld-linux-riscv64-lp64d.so.1  [.] _dl_lookup_symbol_x
...
分析过程中,可获取额外数据,即通过该命令接收的跟踪数据包的的转储文件。该文件以 trace.bin 形式(nexus文件)保存于 ~/.debug 目录下。
root@k3:~# perf report --dump > uname.dump

...省略
0 0x1400 [0x30]: PERF_RECORD_AUXTRACE size: 0x30ab50  offset: 0  ref: 0  idx: 0  tid: 1717  cpu: -1
.
. ... Trace Encoder Trace data: size 0x30ab50 bytes
MSG #0 +0 - ProgTraceSync TCODE[6]=9 SRC[12]=0x5 SYNC[4]=0x5 ICNT[2]=0x0 FADDR[66]=0xffffffffc05b1f1a TSTAMP[36]=0x32fb1f870
MSG #1 +21 - Ownership TCODE[6]=2 SRC[12]=0x5 FORMAT[2]=0x3 PRV[2]=0x1 V[1]=0x0 CONTEXT[1]=0x0 TSTAMP[6]=0x0
MSG #2 +26 - Ownership TCODE[6]=2 SRC[12]=0x5 FORMAT[2]=0x2 PRV[2]=0x1 V[1]=0x0 CONTEXT[13]=0x6b5 TSTAMP[6]=0x0
MSG #3 +33 - IDLE
MSG #4 +34 - IndirectBranch TCODE[6]=4 SRC[12]=0x5 BTYPE[2]=0x0 ICNT[10]=0x16 UADDR[18]=0x35c5 TSTAMP[6]=0x3
MSG #5 +43 - IndirectBranch TCODE[6]=4 SRC[12]=0x5 BTYPE[2]=0x0 ICNT[10]=0x17 UADDR[12]=0x4c7 TSTAMP[6]=0x0
MSG #6 +51 - IndirectBranch TCODE[6]=4 SRC[12]=0x5 BTYPE[2]=0x0 ICNT[4]=0xe UADDR[18]=0x1e78f TSTAMP[6]=0x0
MSG #7 +59 - DirectBranch TCODE[6]=3 SRC[12]=0x5 ICNT[6]=0x10 TSTAMP[6]=0x1
MSG #8 +64 - IndirectBranch TCODE[6]=4 SRC[12]=0x5 BTYPE[2]=0x0 ICNT[10]=0x27 UADDR[12]=0x5e TSTAMP[6]=0x0
MSG #9 +72 - IndirectBranch TCODE[6]=4 SRC[12]=0x5 BTYPE[2]=0x0 ICNT[4]=0xf UADDR[24]=0x4a0615 TSTAMP[6]=0x5
MSG #10 +81 - IndirectBranch TCODE[6]=4 SRC[12]=0x5 BTYPE[2]=0x0 ICNT[10]=0x25 UADDR[24]=0x64fb12 TSTAMP[6]=0x0
MSG #11 +91 - DirectBranch TCODE[6]=3 SRC[12]=0x5 ICNT[6]=0x9 TSTAMP[6]=0x0
MSG #12 +96 - DirectBranch TCODE[6]=3 SRC[12]=0x5 ICNT[6]=0x12 TSTAMP[6]=0x1
MSG #13 +101 - DirectBranch TCODE[6]=3 SRC[12]=0x5 ICNT[12]=0x46 TSTAMP[6]=0x0
MSG #14 +107 - IndirectBranch TCODE[6]=4 SRC[12]=0x5 BTYPE[2]=0x0 ICNT[4]=0x1 UADDR[24]=0x64e4cf TSTAMP[6]=0x0
MSG #15 +116 - DirectBranch TCODE[6]=3 SRC[12]=0x5 ICNT[6]=0x3 TSTAMP[6]=0x0
...
MSG #432340 +2935803 - ProgTraceSync TCODE[6]=9 SRC[12]=0x5 SYNC[4]=0x2 ICNT[8]=0xb FADDR[66]=0xffffffffc05b2954 TSTAMP[36]=0x32fb37eb9
MSG #432341 +2935825 - Ownership TCODE[6]=2 SRC[12]=0x5 FORMAT[2]=0x3 PRV[2]=0x1 V[1]=0x0 CONTEXT[1]=0x0 TSTAMP[6]=0x0
MSG #432342 +2935830 - Ownership TCODE[6]=2 SRC[12]=0x5 FORMAT[2]=0x2 PRV[2]=0x1 V[1]=0x0 CONTEXT[13]=0x6b5 TSTAMP[6]=0x0
MSG #432343 +2935837 - DirectBranch TCODE[6]=3 SRC[12]=0x5 ICNT[6]=0xc TSTAMP[6]=0x3
MSG #432344 +2935842 - ProgTraceCorrelation TCODE[6]=33 SRC[12]=0x5 EVCODE[4]=0x4 CDF[2]=0x0 ICNT[6]=0x11 TSTAMP[6]=0x4
MSG #432345 +2935848 - IDLE

Stat: 2935849 bytes, 5042 idles, 432346 messages, 2585 error messages, 0 invalid messages6.79 bytes/message
root@k3:~# tree -L6 .debug/
.debug/
├── trace.bin
├── usr
│   └── lib
│       ├── cargo
│       │   └── bin
│       │       └── coreutils
│       │           └── uname
│       ├── modules
│       │   └── 6.18.3-generic
│       │       └── kernel
│       │           ├── crypto
│       │           ├── drivers
│       │           ├── fs
│       │           └── net
│       └── riscv64-linux-gnu
│           ├── ld-linux-riscv64-lp64d.so.1
│           │   └── d2f64ebe99ddd9b21c954676ea8c0d3782873f72
│           │       ├── elf
│           │       └── probes
│           ├── libc.so.6
│           │   └── fb5bd55cf11bf0e11b5f59470ff7f0120f96e4de
│           │       ├── elf
│           │       └── probes
│           ├── libgcc_s.so.1
│           │   └── 98e0b48dab10fba41787aad71d770bd2a851ac1b
│           │       ├── elf
│           │       └── probes
│           ├── libm.so.6
│           │   └── 1c11f88d49341bf08cd3a2d9c84bfd3edd19b9b5
│           │       ├── elf
│           │       └── probes
│           ├── libpcre2-8.so.0.14.0
│           │   └── b84e2ac2a793121160ac29cae3d255d5b5f7116e
│           │       ├── elf
│           │       └── probes
│           └── libselinux.so.1
│               └── 0fab3faf7fad97c972e95b19d89be241865caa72
│                   ├── elf
│                   └── probes
└── [vdso]
    └── c0e667f1e4f837863f332fef7d2e6eef6194b673
        ├── probes
        └── vdso
注意:这里产生了2585条错误信息,表明内部 Trace 信息 FIFO 有溢出,导致部分 Trace 信息丢失。
Stat: 2935849 bytes, 5042 idles, 432346 messages, 2585 error messages, 0 invalid messages6.79 bytes/message
3.3.5 跟踪 PC 流解码 - perf script
将每个包解析为下述格式的 perf sample: [应用名] [pid] [cpu] [周期] [branches:] [起始地址] [符号] => [终点地址] [符号]
root@k3:~# perf script
           uname    1717 [005]          1           branches:  ffffffff80b63e34 rvtrace_poll_bit+0x38 ([kernel.kallsyms]) => ffffffff80b63e5e rvtrace_poll_bit+0x62 ([kernel.kallsyms])
           uname    1717 [005]          1           branches:  ffffffff80b655be encoder_enable_hw+0x23e ([kernel.kallsyms]) => ffffffff80b655ea encoder_enable_hw+0x26a ([kernel.kallsyms])
           uname    1717 [005]          1           branches:  ffffffff80b65c30 encoder_enable+0x84 ([kernel.kallsyms]) => ffffffff80b65c4a encoder_enable+0x9e ([kernel.kallsyms])
           uname    1717 [005]          1           branches:  ffffffff80b5932e etm_event_start+0x18e ([kernel.kallsyms]) => ffffffff80b5934c etm_event_start+0x1ac ([kernel.kallsyms])
           uname    1717 [005]          1           branches:  ffffffff80b5935e etm_event_start+0x1be ([kernel.kallsyms]) => ffffffff80b583b4 coresight_get_sink_id+0x18 ([kernel.kallsyms])
           uname    1717 [005]          1           branches:  ffffffff80b59392 etm_event_start+0x1f2 ([kernel.kallsyms]) => ffffffff80b593ac etm_event_start+0x20c ([kernel.kallsyms])
           uname    1717 [005]          1           branches:  ffffffff80219fb8 perf_report_aux_output_id+0x0 ([kernel.kallsyms]) => ffffffff80219ffe perf_report_aux_output_id+0x46 ([kernel.kallsyms])
           uname    1717 [005]          1           branches:  ffffffff80e8699c memset+0x0 ([kernel.kallsyms]) => ffffffff80e869aa memset+0xe ([kernel.kallsyms])
           uname    1717 [005]          1           branches:  ffffffff80e869be memset+0x22 ([kernel.kallsyms]) => ffffffff80e869e0 memset+0x44 ([kernel.kallsyms])
           uname    1717 [005]          1           branches:  ffffffff80e869fc memset+0x60 ([kernel.kallsyms]) => ffffffff80e86a86 memset+0xea ([kernel.kallsyms])
           uname    1717 [005]          1           branches:  ffffffff80e86a96 memset+0xfa ([kernel.kallsyms]) => ffffffff80e86a96 memset+0xfa ([kernel.kallsyms])
           uname    1717 [005]          1           branches:  ffffffff8021a002 perf_report_aux_output_id+0x4a ([kernel.kallsyms]) => ffffffff8021a006 perf_report_aux_output_id+0x4e ([kernel.kallsyms])
           uname    1717 [005]          1           branches:  ffffffff8021a0a6 perf_report_aux_output_id+0xee ([kernel.kallsyms]) => ffffffff8021a020 perf_report_aux_output_id+0x68 ([kernel.kallsyms])
           uname    1717 [005]          1           branches:  ffffffff8021a08c perf_report_aux_output_id+0xd4 ([kernel.kallsyms]) => ffffffff80219ee0 __perf_event_header__init_id+0x28 ([kernel.kallsyms])
           uname    1717 [005]          1           branches:  ffffffff80219f44 __perf_event_header__init_id+0x8c ([kernel.kallsyms]) => ffffffff80219f4c __perf_event_header__init_id+0x94 ([kernel.kallsyms])
           uname    1717 [005]          1           branches:  ffffffff80219fb2 __perf_event_header__init_id+0xfa ([kernel.kallsyms]) => ffffffff80219f5c __perf_event_header__init_id+0xa4 ([kernel.kallsyms])
...
3.3.6 如何解析 OpenSBI 的 Trace 数据
OpenSBI 作为运行在 M 模式下的 RISC-V Linux 固件,其数据在 M/S/U 模式下无法直接访问,因而不能直接进行解析。需通过选项 --firmware <file> 和 --firmware-base <address> 传入 OpenSBI ELF 文件辅助解析。
perf script --firmware ./fw_dynamic.elf --firmware-base 0x100000000
3.3.7 如何确定未知符号的具体位置
遇到 [unknown] 无法找到具体符号时,可以按以下步骤处理:
-
执行以下命令显示 mmap 事件
-
在输出中找到目标库对应的 mmap 记录,获取该库的映射基地址和映射长度
-
在对应库的反汇编结果中,通过计算根据该 offset 查找具体指令位置
root@k3:~# perf script --show-mmap-events
         swapper       0 [000] PERF_RECORD_MMAP2 -1/0: [0xffffffff80002000(0x202f200) @ 0xffffffff80002000 <e105f084d1daa7151a564fb637f559358d56e2ec>]: ---p [kernel.kallsyms]_text
         swapper       0 [000] PERF_RECORD_MMAP2 -1/0: [0xffffffff020bc000(0x6a000) @ 0 <3c40a19014370e5c7cb6f74b5930722e65f936be>]: ---p [autofs4]
         swapper       0 [000] PERF_RECORD_MMAP2 -1/0: [0xffffffff0212a000(0x1d000) @ 0 <3c40a19014370e5c7cb6f74b5930722e65f936be>]: ---p [nfnetlink]
         swapper       0 [000] PERF_RECORD_MMAP2 -1/0: [0xffffffff0214a000(0x2d000) @ 0 <3c40a19014370e5c7cb6f74b5930722e65f936be>]: ---p [sch_fq_codel]
         swapper       0 [000] PERF_RECORD_MMAP2 -1/0: [0xffffffff0217a000(0x236000) @ 0 <3c40a19014370e5c7cb6f74b5930722e65f936be>]: ---p [r8127]
         swapper       0 [000] PERF_RECORD_MMAP2 -1/0: [0xffffffff80002000(0x202f200) @ 0xffffffff80002000 <e105f084d1daa7151a564fb637f559358d56e2ec>]: ---p [kernel.kallsyms]_text
         swapper       0 [000] PERF_RECORD_MMAP2 -1/0: [0xffffffff020bc000(0x6a000) @ 0 <3c40a19014370e5c7cb6f74b5930722e65f936be>]: ---p [autofs4]
         swapper       0 [000] PERF_RECORD_MMAP2 -1/0: [0xffffffff0212a000(0x1d000) @ 0 <3c40a19014370e5c7cb6f74b5930722e65f936be>]: ---p [nfnetlink]
         swapper       0 [000] PERF_RECORD_MMAP2 -1/0: [0xffffffff0214a000(0x2d000) @ 0 <3c40a19014370e5c7cb6f74b5930722e65f936be>]: ---p [sch_fq_codel]
         swapper       0 [000] PERF_RECORD_MMAP2 -1/0: [0xffffffff0217a000(0x236000) @ 0 <3c40a19014370e5c7cb6f74b5930722e65f936be>]: ---p [r8127]
         swapper       0 [000] PERF_RECORD_MMAP2 -1/0: [0xffffffff023b3000(0x89000) @ 0 <3c40a19014370e5c7cb6f74b5930722e65f936be>]: ---p [bluetooth]
         swapper       0 [000] PERF_RECORD_MMAP2 -1/0: [0xffffffff0243c000(0x25000) @ 0 <3c40a19014370e5c7cb6f74b5930722e65f936be>]: ---p [btrtl]
         swapper       0 [000] PERF_RECORD_MMAP2 -1/0: [0xffffffff02465000(0x8000) @ 0 <3c40a19014370e5c7cb6f74b5930722e65f936be>]: ---p [af_alg]
         swapper       0 [000] PERF_RECORD_MMAP2 -1/0: [0xffffffff0246d000(0x2000) @ 0 <3c40a19014370e5c7cb6f74b5930722e65f936be>]: ---p [algif_hash]
         swapper       0 [000] PERF_RECORD_MMAP2 -1/0: [0xffffffff0246f000(0xd000) @ 0 <3c40a19014370e5c7cb6f74b5930722e65f936be>]: ---p [algif_skcipher]
         swapper       0 [000] PERF_RECORD_MMAP2 -1/0: [0xffffffff0247f000(0x6000) @ 0 <3c40a19014370e5c7cb6f74b5930722e65f936be>]: ---p [cmac]
         swapper       0 [000] PERF_RECORD_MMAP2 -1/0: [0xffffffff02485000(0x17000) @ 0 <3c40a19014370e5c7cb6f74b5930722e65f936be>]: ---p [btbcm]
         swapper       0 [000] PERF_RECORD_MMAP2 -1/0: [0xffffffff024af000(0x5000) @ 0 <3c40a19014370e5c7cb6f74b5930722e65f936be>]: ---p [qrtr]
         swapper       0 [000] PERF_RECORD_MMAP2 -1/0: [0xffffffff024b4000(0x59000) @ 0 <3c40a19014370e5c7cb6f74b5930722e65f936be>]: ---p [btintel]
         swapper       0 [000] PERF_RECORD_MMAP2 -1/0: [0xffffffff02554000(0xa000) @ 0 <3c40a19014370e5c7cb6f74b5930722e65f936be>]: ---p [rfcomm]
         swapper       0 [000] PERF_RECORD_MMAP2 -1/0: [0xffffffff0255e000(0x23000) @ 0 <3c40a19014370e5c7cb6f74b5930722e65f936be>]: ---p [binfmt_misc]
         swapper       0 [000] PERF_RECORD_MMAP2 -1/0: [0xffffffff025a5000(0x10000) @ 0 <3c40a19014370e5c7cb6f74b5930722e65f936be>]: ---p [btusb]
         swapper       0 [000] PERF_RECORD_MMAP2 -1/0: [0xffffffff025b5000(0x1a000) @ 0 <3c40a19014370e5c7cb6f74b5930722e65f936be>]: ---p [fusb301]
         swapper       0 [000] PERF_RECORD_MMAP2 -1/0: [0xffffffff025d3000(0x3e000) @ 0 <3c40a19014370e5c7cb6f74b5930722e65f936be>]: ---p [ecc]
         swapper       0 [000] PERF_RECORD_MMAP2 -1/0: [0xffffffff0264c000(0x8000) @ 0 <3c40a19014370e5c7cb6f74b5930722e65f936be>]: ---p [ecdh_generic]
           uname    1717 [-01] 18446744073.709551: PERF_RECORD_MMAP2 1717/1717: [0x2ac05e4000(0xbb3000) @ 0 <0a01c51fa68e0691edbc42433b63fd94f9a7755f>]: r-xp /usr/lib/cargo/bin/coreutils/uname
           uname    1717 [-01] 18446744073.709551: PERF_RECORD_MMAP2 1717/1717: [0x3fa1364000(0x28000) @ 0 <9540ac7413d6c4228cd17cc6134de3e6fb9beb21>]: r-xp /usr/lib/riscv64-linux-gnu/ld-linux-riscv64-lp64d.so.1
           uname    1717 [-01] 18446744073.709551: PERF_RECORD_MMAP2 1717/1717: [0x3fa1362000(0x2000) @ 0 00:00 0 0]: r-xp [vdso]
           uname    1717 [-01] 18446744073.709551: PERF_RECORD_MMAP2 1717/1717: [0x3fa1316000(0x30000) @ 0 <46fa1ca53802f55e5898049e55e9f4e7f54a79c4>]: r-xp /usr/lib/riscv64-linux-gnu/libselinux.so.1
           uname    1717 [-01] 18446744073.709551: PERF_RECORD_MMAP2 1717/1717: [0x3fa12f8000(0x1e000) @ 0 <50e2f95b4ae58f92537f1f96eb580a6f9ac037e6>]: r-xp /usr/lib/riscv64-linux-gnu/libgcc_s.so.1
           uname    1717 [-01] 18446744073.709551: PERF_RECORD_MMAP2 1717/1717: [0x3fa126c000(0x8c000) @ 0 <d7ccb5139173e6921a52c58d256f6c596719cdfb>]: r-xp /usr/lib/riscv64-linux-gnu/libm.so.6
           uname    1717 [-01] 18446744073.709551: PERF_RECORD_MMAP2 1717/1717: [0x3fa10e3000(0x189000) @ 0 <e0967156e0610a957dc33f7c218bf35564a9da9d>]: r-xp /usr/lib/riscv64-linux-gnu/libc.so.6
           uname    1717 [-01] 18446744073.709551: PERF_RECORD_MMAP2 1717/1717: [0x3fa1052000(0x91000) @ 0 <24e486346580a9a60d4d26962f09a224103085dd>]: r-xp /usr/lib/riscv64-linux-gnu/libpcre2-8.so.0.14.0
...
-
某些库显示符号无法找到
以 libselinux.so.1 为例:
uname 1294 [007] 1 branches: 3fad058edc [unknown] (/usr/lib/riscv64-linux-gnu/libselinux.so.1) => 3fad058e7e [unknown] (/usr/lib/riscv64-linux-gnu/libselinux.so.1)uname 1294 [007] 1 branches: 3fad058e80 [unknown] (/usr/lib/riscv64-linux-gnu/libselinux.so.1) => 3fad058e82 [unknown] (/usr/lib/riscv64-linux-gnu/libselinux.so.1)uname 1294 [007] 1 branches: 3fad058e96 [unknown] (/usr/lib/riscv64-linux-gnu/libselinux.so.1) => 3fad058e9c [unknown] (/usr/lib/riscv64-linux-gnu/libselinux.so.1)uname 1294 [007] 1 branches: 3fad0a5218 call_init+0x8a (/usr/lib/riscv64-linux-gnu/ld-linux-riscv64-lp64d.so.1) => 3fad0a521a call_init+0x8c (/usr/lib/riscv64-linux-gnu/ld-linux-riscv64-lp64d.so.1)uname 1294 [007] 1 branches: 3fad0a520c call_init+0x7e (/usr/lib/riscv64-linux-gnu/ld-linux-riscv64-lp64d.so.1) => 3fad0a5216 call_init+0x88 (/usr/lib/riscv64-linux-gnu/ld-linux-riscv64-lp64d.so.1)-
libselinux.so.1 的 mmap 基地址和长度为
0x3fad052000(0x31000) -
计算 3fad058e7e [unknown] 的offset为
6e7e -
查看libselinux.so.1 的符号地址,6e7e 不处于特定符号区间,因此 perf 无法将其解析为任何已知符号,只能显示为 [unknown]
root@k3:~# nm -D /usr/lib/riscv64-linux-gnu/libselinux.so.1 | head -20U abort@GLIBC_2.27U access@GLIBC_2.27U alphasort64@GLIBC_2.27U __asprintf_chk@GLIBC_2.27U __assert_fail@GLIBC_2.270000000000008cd4 T avc_add_callback@@LIBSELINUX_1.000000000000083de T avc_audit@@LIBSELINUX_1.00000000000008054 T avc_av_stats@@LIBSELINUX_1.00000000000007f0c T avc_cache_stats@@LIBSELINUX_1.00000000000008172 T avc_cleanup@@LIBSELINUX_1.00000000000008ac8 T avc_compute_create@@LIBSELINUX_1.00000000000008bf2 T avc_compute_member@@LIBSELINUX_1.00000000000007ca8 T avc_context_to_sid@@LIBSELINUX_1.00000000000007c1e T avc_context_to_sid_raw@@LIBSELINUX_1.000000000000082a4 T avc_destroy@@LIBSELINUX_1.00000000000007dfa T avc_get_initial_sid@@LIBSELINUX_1.00000000000008a3a T avc_has_perm@@LIBSELINUX_1.00000000000008838 T avc_has_perm_noaudit@@LIBSELINUX_1.00000000000007ee6 T avc_init@@LIBSELINUX_1.00000000000009a92 T avc_netlink_acquire_fd@@LIBSELINUX_1.0 -
-
uname 部分地址符号无法找到
uname 1294 [007] 1 branches: 2ae048ca72 main+0xc (/usr/lib/cargo/bin/coreutils/uname) => 2ae048ca8a main+0x24 (/usr/lib/cargo/bin/coreutils/uname)uname 1294 [007] 1 branches: 2ae048d070 [unknown] (/usr/lib/cargo/bin/coreutils/uname) => 2ae048d092 [unknown] (/usr/lib/cargo/bin/coreutils/uname)计算 2ae048d070
[unknown]的 offset 为1b070同样处于 main。仍然落在 main 函数所在区域内,然而通过得到的 main 在符号表中显示仅有 48 个字节,这与实际代码范围不符(属于在使用 Rust 编译的二进制文件中常见问题)root@k3:~# readelf -s /usr/lib/cargo/bin/coreutils/uname | grep main671: 00000000001b6a66 48 FUNC GLOBAL DEFAULT 11 main
3.3.8 常见解析失败原因
-
Missing DSO
Warning:RISC-V Nexus Trace: Missing DSO. Use 'perf archive' or debuginfod to export data from the traced system.Enable CONFIG_PROC_KCORE or use option '-k /path/to/vmlinux' for kernel symbols.linux menuconfig中启用
CONFIG_PROC_KCORE,如果还是出现这个报错,检查perf编译选项,libelf要启用root@k3:~# perf version --build-optionsperf version 6.18.3.ge93dfda71df6aio: [ on ] # HAVE_AIO_SUPPORTbpf: [ on ] # HAVE_LIBBPF_SUPPORTbpf_skeletons: [ OFF ] # HAVE_BPF_SKELdebuginfod: [ OFF ] # HAVE_DEBUGINFOD_SUPPORTdwarf: [ on ] # HAVE_LIBDW_SUPPORTdwarf_getlocations: [ on ] # HAVE_LIBDW_SUPPORTdwarf-unwind: [ on ] # HAVE_DWARF_UNWIND_SUPPORTauxtrace: [ on ] # HAVE_AUXTRACE_SUPPORTlibbfd: [ OFF ] # HAVE_LIBBFD_SUPPORT ( tip: Deprecated, license incompatibility, use BUILD_NONDISTRO=1 and install binutils-dev[el] )libbpf-strings: [ on ] # HAVE_LIBBPF_STRINGS_SUPPORTlibcapstone: [ OFF ] # HAVE_LIBCAPSTONE_SUPPORTlibdw-dwarf-unwind: [ on ] # HAVE_LIBDW_SUPPORTlibelf: [ on ] # HAVE_LIBELF_SUPPORTlibLLVM: [ OFF ] # HAVE_LIBLLVM_SUPPORTlibnuma: [ on ] # HAVE_LIBNUMA_SUPPORTlibopencsd: [ OFF ] # HAVE_CSTRACE_SUPPORTlibperl: [ OFF ] # HAVE_LIBPERL_SUPPORT ( tip: Deprecated, use LIBPERL=1 and install perl-ExtUtils-Embed/libperl-dev to build with it )libpfm4: [ on ] # HAVE_LIBPFMlibpython: [ OFF ] # HAVE_LIBPYTHON_SUPPORTlibslang: [ on ] # HAVE_SLANG_SUPPORTlibtraceevent: [ on ] # HAVE_LIBTRACEEVENTlibunwind: [ OFF ] # HAVE_LIBUNWIND_SUPPORT ( tip: Deprecated, use LIBUNWIND=1 and install libunwind-dev[el] to build with it )lzma: [ on ] # HAVE_LZMA_SUPPORTnuma_num_possible_cpus: [ on ] # HAVE_LIBNUMA_SUPPORTzlib: [ on ] # HAVE_ZLIB_SUPPORTzstd: [ on ] # HAVE_ZSTD_SUPPORT
3.3.9 多进程的简单示例
root@k3:~# cat test_fork.c
#include <stdio.h>
#include <stdlib.h>
#include <unistd.h>
#include <sys/types.h>
#include <sys/wait.h>
#include <sched.h>

// 子进程执行的任务
void child_task() {
    printf("Child process: Running on CPU=%d PID=%d\n", sched_getcpu(), getpid());
    sleep(1);  // 模拟任务
    printf("Child process: Task finished\n");
}

int main() {
    pid_t pid;

    // 创建一个子进程
    pid = fork();

    if (pid == -1) {
        // fork 出错
        perror("fork failed");
        exit(1);
    } else if (pid == 0) {
        // 子进程
        child_task();
        exit(0);  // 子进程执行完任务后退出
    } else {
        // 父进程
        printf("Parent process: Waiting for child to finish...\n");
        wait(NULL);  // 等待子进程结束
        printf("Parent process: Child finished\n");
    }

    return 0;
}

root@k3:~# gcc -D_GNU_SOURCE test_fork.c -o test_fork
root@k3:~# perf record -e rvtrace/@tmc_etr0/ ./test_fork
Parent process: Waiting for child to finish...
Child process: Running on CPU=5 PID=2121
Child process: Task finished
Parent process: Child finished
[ perf record: Woken up 1 times to write data ]
[ perf record: Captured and wrote 0.628 MB perf.data ]
root@k3:~# perf script > test_fork.log
root@k3:~# grep "\/root\/test_fork" test_fork.log -nrI
41715:       test_fork    2120 [001]   103.804604:          1           branches:        2ac8c88812 load_gp+0x0 (/root/test_fork) =>       2ac8c8881a load_gp+0x8 (/root/test_fork)
41749:       test_fork    2120 [001]   103.804604:          1           branches:        2ac8c887f0 _start+0x0 (/root/test_fork) =>       2ac8c8881a load_gp+0x8 (/root/test_fork)
41750:       test_fork    2120 [001]   103.804604:          1           branches:        2ac8c887f4 _start+0x4 (/root/test_fork) =>       2ac8c88768 __libc_start_main@plt+0x8 (/root/test_fork)
41758:       test_fork    2120 [001]   103.804604:          1           branches:        2ac8c888d2 frame_dummy+0x0 (/root/test_fork) =>       2ac8c88878 register_tm_clones+0x24 (/root/test_fork)
41759:       test_fork    2120 [001]   103.804604:          1           branches:        2ac8c8888c register_tm_clones+0x38 (/root/test_fork) =>       2ac8c88892 register_tm_clones+0x3e (/root/test_fork)
41765:       test_fork    2120 [001]   103.804604:          1           branches:        2ac8c8892a main+0x0 (/root/test_fork) =>       2ac8c88788 fork@plt+0x8 (/root/test_fork)
59213:       test_fork    2120 [001]   103.804610:          1           branches:        2ac8c88936 main+0xc (/root/test_fork) =>       2ac8c88936 main+0xc (/root/test_fork)
59509:       test_fork    2120 [001]   103.804610:          1           branches:        2ac8c88938 main+0xe (/root/test_fork) =>       2ac8c8893c main+0x12 (/root/test_fork)
59510:       test_fork    2120 [001]   103.804610:          1           branches:        2ac8c88940 main+0x16 (/root/test_fork) =>       2ac8c88946 main+0x1c (/root/test_fork)
59511:       test_fork    2120 [001]   103.804610:          1           branches:        2ac8c8895c main+0x32 (/root/test_fork) =>       2ac8c88962 main+0x38 (/root/test_fork)
59512:       test_fork    2120 [001]   103.804610:          1           branches:        2ac8c8896e main+0x44 (/root/test_fork) =>       2ac8c88798 puts@plt+0x8 (/root/test_fork)
65513:       test_fork    2120 [001]   103.804611:          1           branches:        2ac8c8897a main+0x50 (/root/test_fork) =>       2ac8c88758 wait@plt+0x8 (/root/test_fork)
68282:       test_fork    2121 [005]   103.804612:          1           branches:        2ac8c88936 main+0xc (/root/test_fork) =>       2ac8c88946 main+0x1c (/root/test_fork)
68283:       test_fork    2121 [005]   103.804612:          1           branches:        2ac8c8895c main+0x32 (/root/test_fork) =>       2ac8c88770 sched_getcpu@plt+0x0 (/root/test_fork)
68376:       test_fork    2121 [005]   103.804612:          1           branches:        2ac8c88774 sched_getcpu@plt+0x4 (/root/test_fork) =>       2ac8c88774 sched_getcpu@plt+0x4 (/root/test_fork)
68377:       test_fork    2121 [005]   103.804612:          1           branches:        2ac8c88778 sched_getcpu@plt+0x8 (/root/test_fork) =>       2ac8c88778 sched_getcpu@plt+0x8 (/root/test_fork)
68931:       test_fork    2121 [005]   103.804612:          1           branches:        2ac8c888f0 child_task+0xe (/root/test_fork) =>       2ac8c887a8 getpid@plt+0x8 (/root/test_fork)
68958:       test_fork    2121 [005]   103.804612:          1           branches:        2ac8c888f8 child_task+0x16 (/root/test_fork) =>       2ac8c887e8 printf@plt+0x8 (/root/test_fork)
75290:       test_fork    2121 [005]   103.804614:          1           branches:        2ac8c8890a child_task+0x28 (/root/test_fork) =>       2ac8c8890c child_task+0x2a (/root/test_fork)
75291:       test_fork    2121 [005]   103.804614:          1           branches:        2ac8c887d0 sleep@plt+0x0 (/root/test_fork) =>       2ac8c887d8 sleep@plt+0x8 (/root/test_fork)
75930:       test_fork    2121 [005]   103.828616:          1           branches:        2ac8c88910 child_task+0x2e (/root/test_fork) =>       2ac8c88798 puts@plt+0x8 (/root/test_fork)
76471:       test_fork    2121 [005]   103.828617:          1           branches:        2ac8c8891c child_task+0x3a (/root/test_fork) =>       2ac8c88928 child_task+0x46 (/root/test_fork)
76472:       test_fork    2121 [005]   103.828617:          1           branches:        2ac8c88968 main+0x3e (/root/test_fork) =>       2ac8c887c8 exit@plt+0x8 (/root/test_fork)
77486:       test_fork    2121 [005]   103.828617:          1           branches:        2ac8c88894 __do_global_dtors_aux+0x0 (/root/test_fork) =>       2ac8c88894 __do_global_dtors_aux+0x0 (/root/test_fork)
77582:       test_fork    2121 [005]   103.828617:          1           branches:        2ac8c88898 __do_global_dtors_aux+0x4 (/root/test_fork) =>       2ac8c888b8 __do_global_dtors_aux+0x24 (/root/test_fork)
77589:       test_fork    2121 [005]   103.828617:          1           branches:        2ac8c888ba __do_global_dtors_aux+0x26 (/root/test_fork) =>       2ac8c88836 deregister_tm_clones+0x18 (/root/test_fork)
77590:       test_fork    2121 [005]   103.828617:          1           branches:        2ac8c8884c deregister_tm_clones+0x2e (/root/test_fork) =>       2ac8c88852 deregister_tm_clones+0x34 (/root/test_fork)
77591:       test_fork    2121 [005]   103.828617:          1           branches:        2ac8c888be __do_global_dtors_aux+0x2a (/root/test_fork) =>       2ac8c888c4 __do_global_dtors_aux+0x30 (/root/test_fork)
77884:       test_fork    2121 [005]   103.828617:          1           branches:        2ac8c888c8 __do_global_dtors_aux+0x34 (/root/test_fork) =>       2ac8c888ce __do_global_dtors_aux+0x3a (/root/test_fork)
78730:       test_fork    2120 [001]   103.828624:          1           branches:        2ac8c88980 main+0x56 (/root/test_fork) =>       2ac8c88798 puts@plt+0x8 (/root/test_fork)
79298:       test_fork    2120 [001]   103.828624:          1           branches:        2ac8c8898c main+0x62 (/root/test_fork) =>       2ac8c88996 main+0x6c (/root/test_fork)
79690:       test_fork    2120 [001]   103.828624:          1           branches:        2ac8c88894 __do_global_dtors_aux+0x0 (/root/test_fork) =>       2ac8c888b8 __do_global_dtors_aux+0x24 (/root/test_fork)
79813:       test_fork    2120 [001]   103.828625:          1           branches:        2ac8c888ba __do_global_dtors_aux+0x26 (/root/test_fork) =>       2ac8c88836 deregister_tm_clones+0x18 (/root/test_fork)
79814:       test_fork    2120 [001]   103.828625:          1           branches:        2ac8c8884c deregister_tm_clones+0x2e (/root/test_fork) =>       2ac8c88852 deregister_tm_clones+0x34 (/root/test_fork)
79815:       test_fork    2120 [001]   103.828625:          1           branches:        2ac8c888be __do_global_dtors_aux+0x2a (/root/test_fork) =>       2ac8c888c4 __do_global_dtors_aux+0x30 (/root/test_fork)
79923:       test_fork    2120 [001]   103.828625:          1           branches:        2ac8c888c8 __do_global_dtors_aux+0x34 (/root/test_fork) =>       2ac8c888ce __do_global_dtors_aux+0x3a (/root/test_fork)
4. Trace 的解析
4.1 使用 NexRv 解码工具
$ ./NexRv.exe

NexRv v1.0.0 (2025/01/02)
Usage:
  NexRv -dump <nex> [<dump>] [-nsrc <num>] [-force] [-msg|-none] - dump Nexus file
  NexRv -deco <nex> -pcinfo <info> -pcout <pco> [-nsrc <num>] [-srcid <srcid>] [-scontext <scontext>] [-force] [-stat|-full|-all|-msg|-none]  decode trace
  NexRv -enco <pcseq> -nex <nex> [-nobhm|-norbm|-cs [<cs>]|-rpt <m>] [-stat|-full|-all|-msg|-none] - encode trace
  NexRv -conv -objd <objd> -pcinfo <pci> - create <pci> from objdump -d output <objd>
  NexRv -conv -pcinfo <pci> -pconly <pco> -pcseq <pcs> - convert <pco> to <pcs> using <pci>
  NexRv -conv -rtl <rtl> -pconly <pco> -  create <pco> file from <rtl> trace file
  NexRv -conv -hex <hex> -bin <bin> - convert <hex> to <bin>
  NexRv -conv -ddr <ddr> -nex <nex> [-atid <id>] - convert <ddr> to <nex> - remove coresight formatter frame
  NexRv -diff -pcseq <pcs> -pcout <pco> - compare <pcs> with <pco>
where:
  -nobhm|-norbm               - do not generate Branch History/Repeat Branch Messages
  -cs [<cs>]                  - enable call-stack level <cs> (0=none, 8 is default)
  -rpt [<m>]                  - enable repeat detection (0=none,1=repeat branch,2=repeat history)
  -stat|-full|-all|-msg|-none - verbose level
  -nsrc [<num>]               - number of source bits <num> (default no source field)
  -srcid [<srcid>]            - enable decoding a specific hart
  -atid [<id>]                - decode the trace formatter of the atid
  -force                      - force continue when error
4.1.1 移除 CoreSight formatter frame
K3 Trace 通过 ATB-bridge 组件将 RISC-V Trace 发送到 Arm CoreSight sink,从 DDR 获取的 Trace 数据仍包含 CoreSight formatter frame,后续处理前需要先行移除。
$ ./NexRv.exe -conv -ddr bubule.bin -nex bubule.nex
Converted OK (43 instructions)
4.1.2 Dump Nexus Message (可选)
在移除 CoreSight formatter frame 后,可以选择将得到的 Nexus Trace 数据转化为可读的 Nexus Message。
$ ./NexRv.exe -dump bubule.nex > bubule.dump
4.1.3 将 ELF 文件转化为 PC 指令信息
$ riscv64-unknown-elf-objdump -d bubule.elf > bubule.objd
$ ./NexRv.exe -conv -objd bubule.objd -pcinfo bubule.pci
4.1.4 解码成 PC 序列
$ ./NexRv.exe -deco bubule.nex -pcinfo bubule.pci -pcout bubule.pco
NexRv/Info: amin=0x100000000, amax=0x1000016FE, nRec=2092
Stat: 570 bytes, 116 messages, 0 error messages, 4.91 bytes/message, 1756 instr, 2.597 bits/instr
Decoded OK (1756 instructions)

$ cat bubule.pco
0x100000098
0x10000009C
0x1000000A0
0x1000000A2
0x1000000A4
0x1000000A6
0x1000000A8
0x1000000AA
0x1000000AE
0x1000000B2
0x1000000B6
...
4.2 使用 T32 解析工具
TBD